
If you are a modeler at COAPS and are looking for a quick reference, skip to the Quick References section.
The first thing you need to do is download VisIt. It was developed by the Department of Energy and is widely used in scientific visualization.
There are various resources online to learn the ins-and-outs of VisIt. I will not repeat them here.
In this section we’ll be outlining how to load your new VTK data and how to visualize it given it’s format.
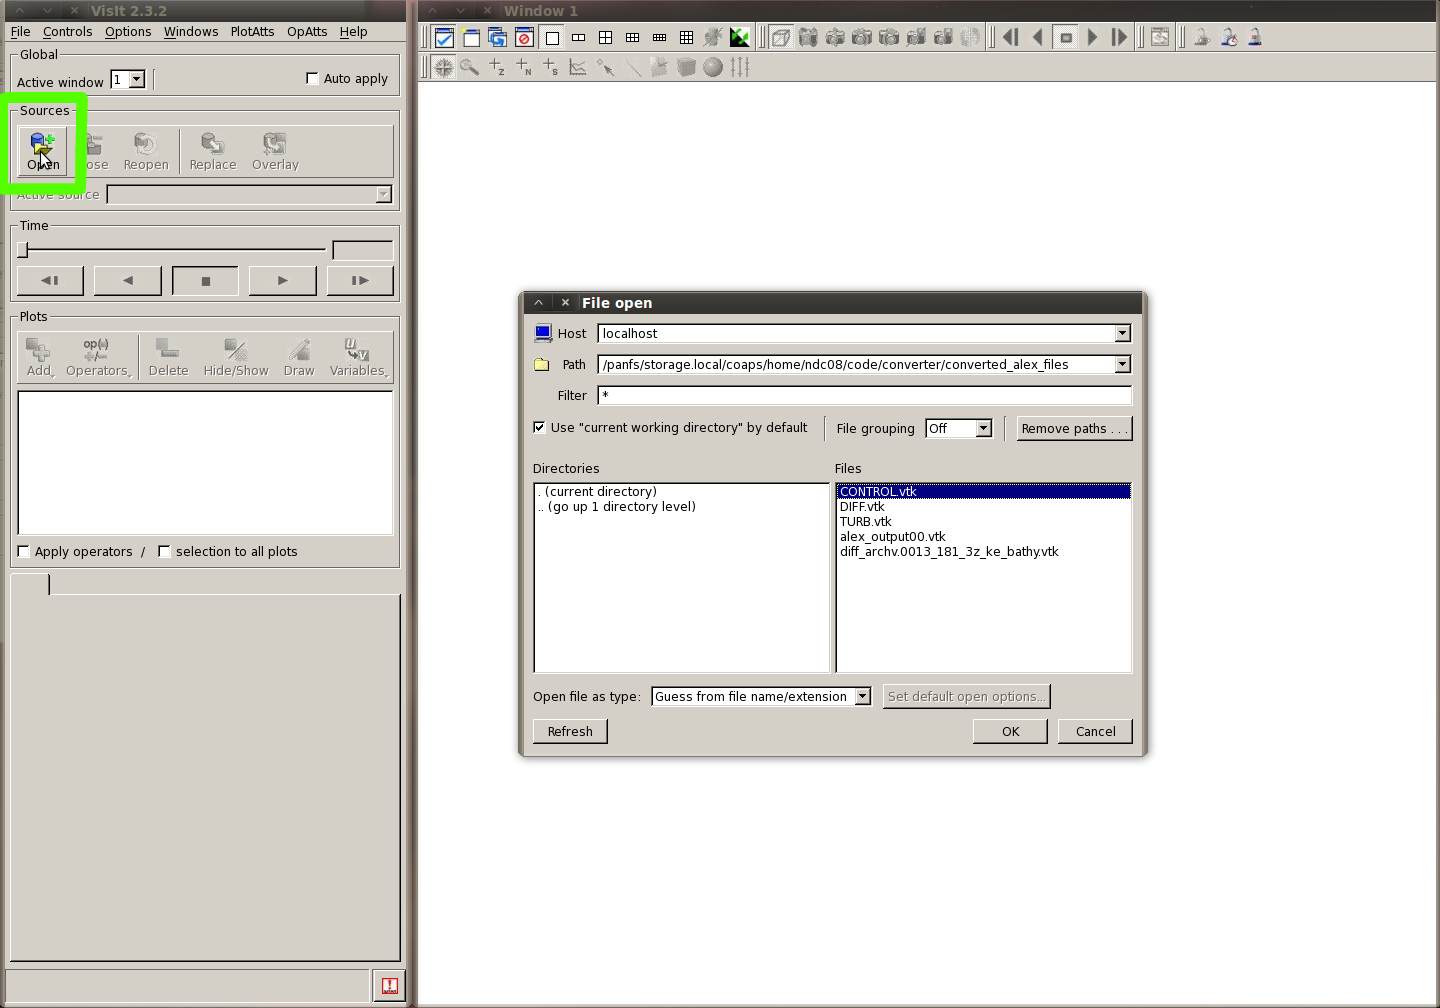
Once you create your VTK files, loading them into visit is as simple as clicking the Open button and finding it in the filesystem. If you convert multiple time steps and each file is numbered sequentially, VisIt has a smart reader which will group all files with the same name, which only vary by the number at the end, into one dataset. Open your VTK dataset as shown below.
VisIt can natively read in the NetCDF file format. Unfortunately due to the extremely general format of NetCDF VisIt might not always understand exactly what your data is suppose to look like. This is one of the primary benefits of the Convert2VTK project, by having such simple modules, one can completely customize how VisIt will read in their model output. Given the grid stucture of most model output, the bathymetry plot rendered on a grid with say 30 z levels is quite unattractive. The ocean floor looks blocky and unrealistic. To ameleorate this issue, we load the bathymetry into a separate VTK file, with its own grid. This grid has only 4 levels:
Because the mesh differs from that of the actual data, the data can’t be presented on this grid requiring us to generate them separately. With the bathymetry stored this way, visualizaing it in a seemingly continuous manner requires a few extra steps.
The idea is to draw a contour between the bathymetry+epsilon and bathymetry-epsilon layers on the curvilinear mesh. So we select the contour option from within the plot menu and select the bathymetry.
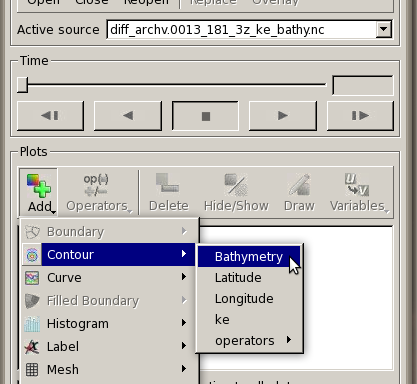
As a side note, the bathymetry is going to be stored in a variable name chosen by the author of the module you used to convert it. Ideally it will be named something obvious, such as bathymetry... or h, as shown below.

Once the contour plot has been selected the user has many options. The last one required however is to edit the contour plot attributes. Double click on the plot name in the window listing all of the plot types. The contour attributes window should open up. From here you need to tell VisIt to plot the contour by ‘percent’, and set the percentage to 50. The figure below should make it more clear

This makes sense when we recall that the mesh has only 4 levels, and 50 percent will be between the two epsilon levels which outline the bathymetry. Now we’re almost done.
Ocean models take into consideration the ocean depths and geographic locations typically using latitude and logitude. The ocean depths have a much larger magnitude than the varying lat lon values. A common domain may be explored with lat and lon values varying by only 10-20 degrees, this contrasts greatly with a typical ocean depth varying from 0-3,500 meters. This can create a problem for our plot. VisIt doesn’t know that the X-Y axis is in different units than the Z axis, so it scales everything equally. This produces a plot grossly stretched in the vertical direction.
To fix this, we apply the transform operator. This operator will allow us to scale and translate any axis, how ever we please.
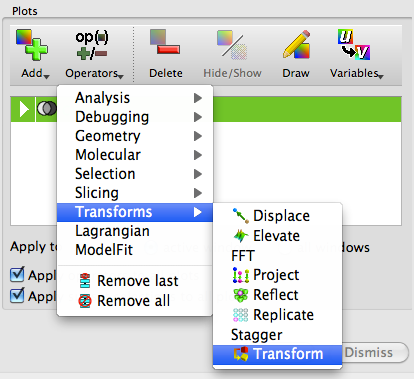
Usually, scaling the z axis by .001, or .0001 can bring the plot back to reasonable proportions.

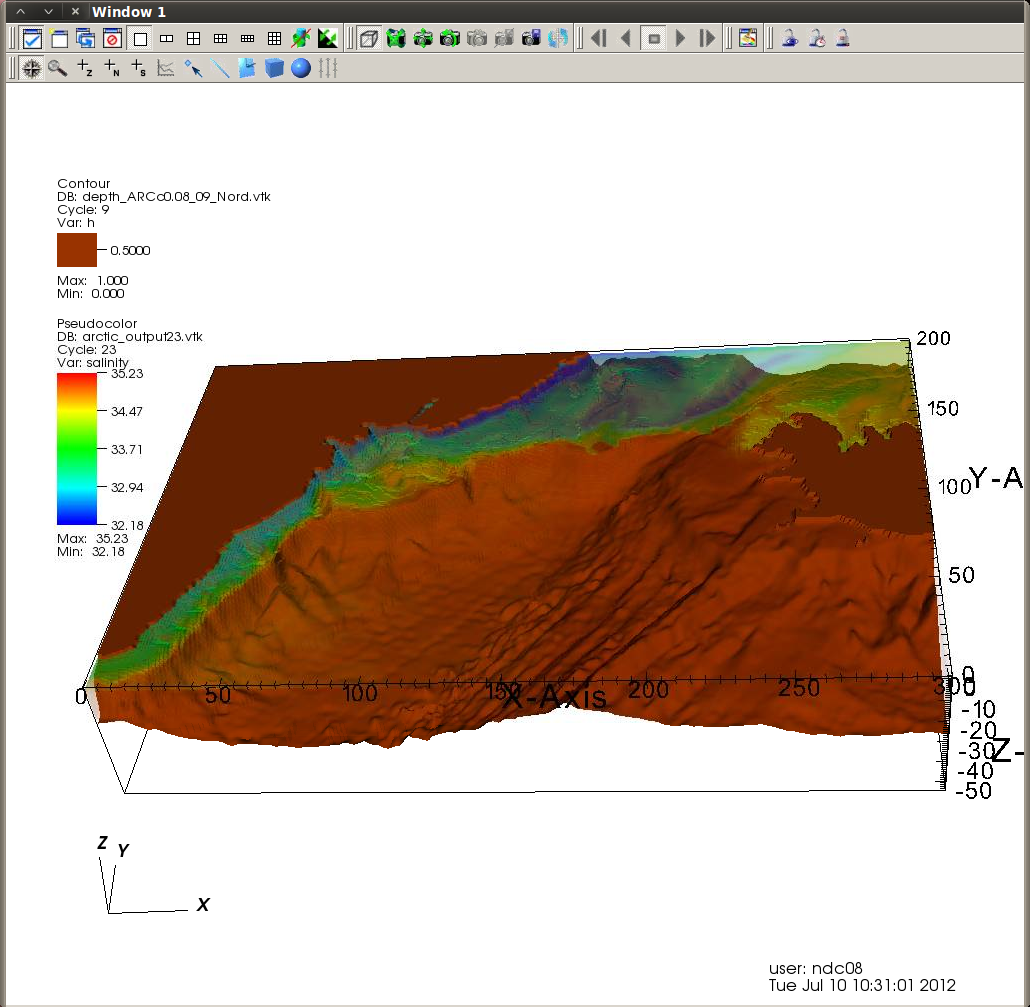
This creates a nice smooth surface representing the bathymetry - which is much preferred over the blocky alternative. Here is an example of what a bathymetry plot might look like.
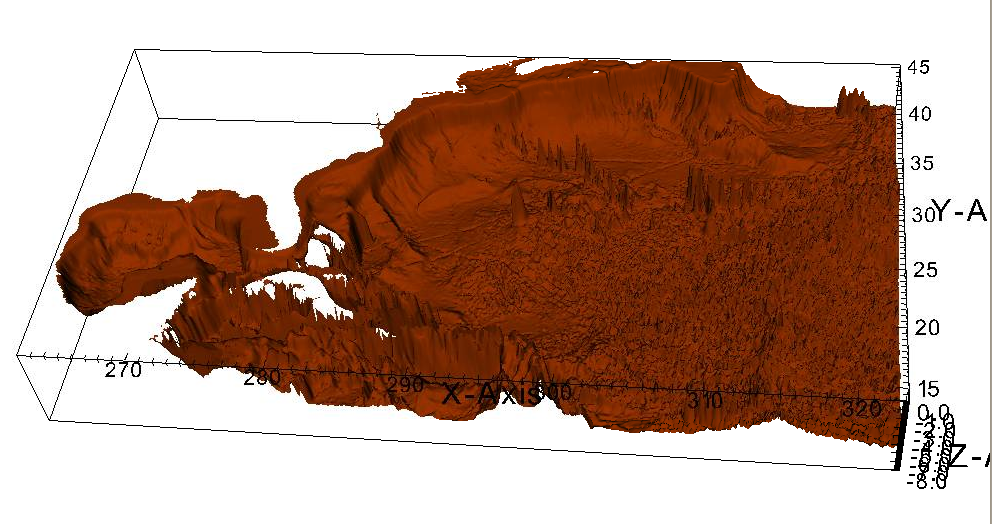
Visualizing the actual data file is similar to the process above. After we load the VTK file containing the actual data, selecting the plot type and variable puts us one step away from being finished. With this database we don’t need to worry about the contour issues any longer, however for the last step we do still need to apply the transform operator. A Pseudocolor plot of the salinity from a HYCOM model of the artic region might look something like this.
