
Set up your PATH environment variable to point to the project on the HPC. The Convert2VTK project is stored in the common directory in the coaps home folder.
If you’re using BASH:
Add the path to your .bashrc file:
PATH=$PATH:/panfs/storage.local/coaps/common/convert2vtk
export PATH
Also source the .bashrc file in your .bash_profile:
if [ -f "$HOME/.bashrc" ]; then
    . "$HOME/.bashrc"
fi
The .bash_profile is called everytime a user logs in to their account, and the .bashrc is called everytime a new terminal is opened.
You can call the conversion utility with the c2v command:
$ c2v data parameter_file
data - The path to your model output data file
parameter_file - The path to your parameter file
This file provides the user with a variety of options for them to customize their conversion process. The options are listed below.
Specify the filetype with ‘input_filetype’ - hycom_z, hycom_binary, roms, ncom, modflow, etc...
input_filetype = hycom_z
Specify where you would like the output files to be saved. If you do not use a complete path, it will create the folder in the directory where you call c2v. If you leave this blank it will create a folder called ‘converted_files’
output_directory = directory_of_you_choice
You can specify the name of each converted file in the output_directory. Not specifying output_filename will append a .vtk to the end of the current filename
output_filename = name_of_your_choice
List the variables in the file you wish to convert, separated by spaces. The names must match the variable name in the data exactly. If both u and v components of a vector are read in, a vector field will automatically be generated along with the scalar components
variables = salinity temperature u_data v_data
One has the option to chose only a small time slice from the file (if there are more than one) Ignoring these lines will tell c2v to use the entire time series
timeBegin = 0
timeEnd = 1
One can also select a subregion of the file for faster more efficient visualization. Commenting out these lines, or leaving them blank will use the entire region. For example if you comment out jbegin = 200 it will automatically be set to 0. If you comment out jend, it will be set to the domain size
ibegin = 200
iend = 800
jbegin = 200
jend = 1000
kbegin = 5
kend = 5
Specify a bathymetry file if you need topography in your visualization. This will create a separate vtk file with one variable called ‘h’
bathymetry = /path/to/bathymetry/file
Set the gridspace flag to True if you would like x and y to be discretized by gridspace as opposed to the default longitude and latitude. This is useful for dealing with things like polar regions
gridspace = True
You can choose a factor to subsample your data by if you’re visualizing on a machine with limited resources, or the resolution is higher than needed
subsample = 2
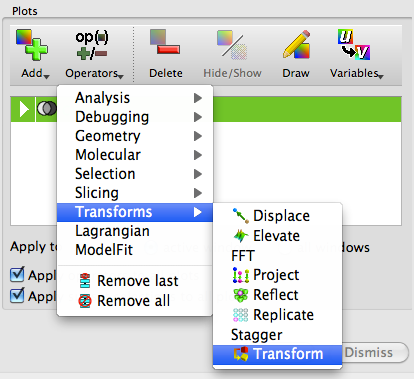
There are two steps to plotting the bathymetry


The actual variables from the main VTK file only need to be transformed.